Algorithm comparison
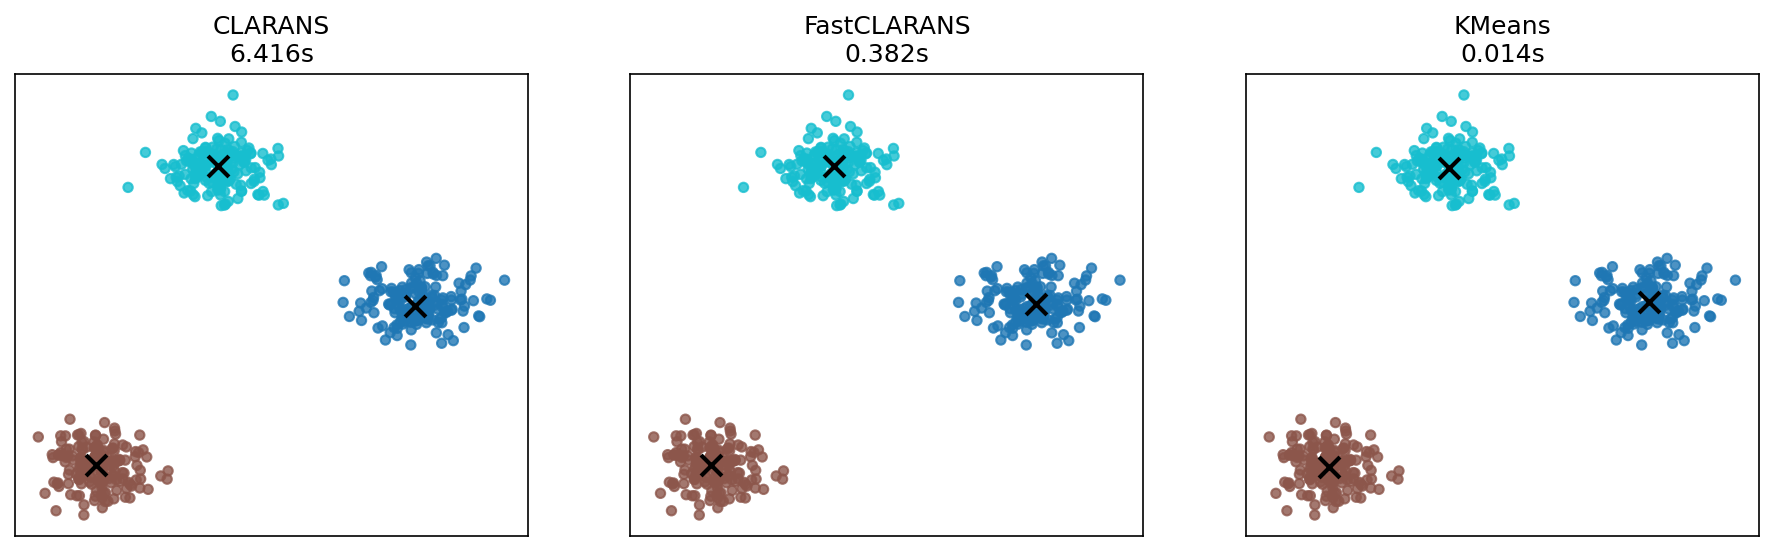
Side-by-side comparison of CLARANS, FastCLARANS and scikit-learn’s KMeans on the same dataset.
 1"""Generate `comparison_clustering.png`.
 2
 3Side-by-side comparison of CLARANS, FastCLARANS and scikit-learn's KMeans.
 4"""
 5from pathlib import Path
 6import time
 7import matplotlib
 8matplotlib.use("Agg")
 9import matplotlib.pyplot as plt
10from sklearn.datasets import make_blobs
11from clarans import CLARANS, FastCLARANS
12from sklearn.cluster import KMeans
13
14
15def main():
16    X, _ = make_blobs(n_samples=500, centers=3, random_state=42)
17    models = [
18        ("CLARANS", CLARANS(n_clusters=3, numlocal=5, random_state=42)),
19        ("FastCLARANS", FastCLARANS(n_clusters=3, numlocal=5, random_state=42)),
20        ("KMeans", KMeans(n_clusters=3, random_state=42)),
21    ]
22
23    fig, axes = plt.subplots(1, 3, figsize=(15, 4))
24
25    for ax, (name, model) in zip(axes, models):
26        t0 = time.perf_counter()
27        model.fit(X)
28        t1 = time.perf_counter()
29        labels = model.labels_
30        centers = getattr(model, "cluster_centers_", None)
31        ax.scatter(X[:, 0], X[:, 1], c=labels, s=20, cmap="tab10", alpha=0.8)
32        if centers is not None:
33            ax.scatter(centers[:, 0], centers[:, 1], c="black", marker="x", s=100, linewidths=2)
34        ax.set_title(f"{name}\n{(t1-t0):.3f}s")
35        ax.set_xticks([])
36        ax.set_yticks([])
37
38    out = "comparison_clustering.png"
39    fig.savefig(out, bbox_inches="tight", dpi=150)
40    print(f"Saved {out}")
41
42
43if __name__ == "__main__":
44    main()