Performance tuning
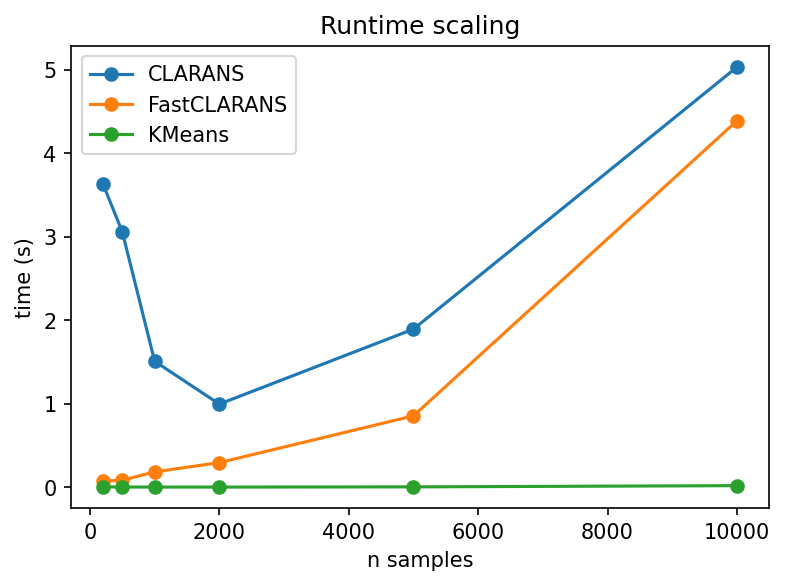
Runtime scaling across dataset sizes (CLARANS, FastCLARANS, KMeans).
 1"""Generate `runtime_scaling.png` comparing runtimes for different data sizes.
 2"""
 3from pathlib import Path
 4import time
 5import matplotlib
 6matplotlib.use("Agg")
 7import matplotlib.pyplot as plt
 8from sklearn.datasets import make_blobs
 9from clarans import CLARANS, FastCLARANS
10from sklearn.cluster import KMeans
11
12
13def main():
14    Ns = [200, 500, 1000, 2000]
15    clarans_times = []
16    fast_times = []
17    kmeans_times = []
18
19    for N in Ns:
20        X, _ = make_blobs(n_samples=N, centers=4, cluster_std=0.60, random_state=42)
21
22        t0 = time.perf_counter()
23        CLARANS(n_clusters=4, numlocal=1, random_state=42).fit(X)
24        clarans_times.append(time.perf_counter() - t0)
25
26        t0 = time.perf_counter()
27        FastCLARANS(n_clusters=4, numlocal=1, random_state=42).fit(X)
28        fast_times.append(time.perf_counter() - t0)
29
30        t0 = time.perf_counter()
31        KMeans(n_clusters=4, random_state=42).fit(X)
32        kmeans_times.append(time.perf_counter() - t0)
33
34    fig, ax = plt.subplots(figsize=(6, 4))
35    ax.plot(Ns, clarans_times, marker="o", label="CLARANS")
36    ax.plot(Ns, fast_times, marker="o", label="FastCLARANS")
37    ax.plot(Ns, kmeans_times, marker="o", label="KMeans")
38    ax.set_xlabel("n samples")
39    ax.set_ylabel("time (s)")
40    ax.set_title("Runtime scaling (numlocal=1)")
41    ax.legend()
42
43    out = "runtime_scaling.png"
44    fig.savefig(out, bbox_inches="tight", dpi=150)
45    print(f"Saved {out}")
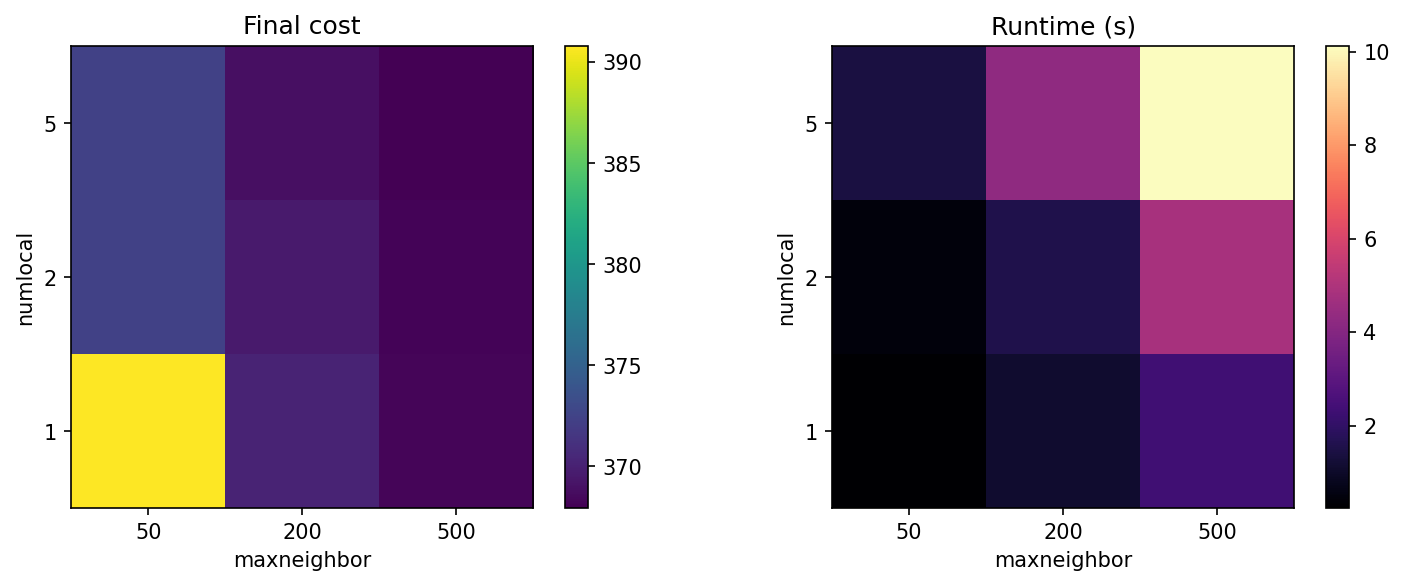
Sensitivity of final cost / runtime to numlocal and maxneighbor.
 1"""Generate `parameter_sensitivity.png` showing cost/runtime for parameter grid.
 2"""
 3from pathlib import Path
 4import time
 5import numpy as np
 6import matplotlib
 7matplotlib.use("Agg")
 8import matplotlib.pyplot as plt
 9from sklearn.datasets import make_blobs
10from clarans import CLARANS
11from clarans.utils import calculate_cost
12
13
14def main():
15    X, _ = make_blobs(n_samples=500, centers=4, cluster_std=0.60, random_state=42)
16    numlocals = [1, 2, 5]
17    maxneighbors = [50, 200, 500]
18
19    cost_grid = np.zeros((len(numlocals), len(maxneighbors)))
20    time_grid = np.zeros_like(cost_grid)
21
22    for i, nl in enumerate(numlocals):
23        for j, mn in enumerate(maxneighbors):
24            t0 = time.perf_counter()
25            model = CLARANS(n_clusters=4, numlocal=nl, maxneighbor=mn, random_state=42)
26            model.fit(X)
27            time_grid[i, j] = time.perf_counter() - t0
28            cost_grid[i, j] = calculate_cost(X, model.medoid_indices_)
29
30    fig, axes = plt.subplots(1, 2, figsize=(12, 4))
31    im0 = axes[0].imshow(cost_grid, cmap="viridis", origin="lower")
32    axes[0].set_xticks(range(len(maxneighbors)))
33    axes[0].set_xticklabels([str(m) for m in maxneighbors])
34    axes[0].set_yticks(range(len(numlocals)))
35    axes[0].set_yticklabels([str(n) for n in numlocals])
36    axes[0].set_xlabel("maxneighbor")
37    axes[0].set_ylabel("numlocal")
38    axes[0].set_title("Final cost")
39    fig.colorbar(im0, ax=axes[0])
40
41    im1 = axes[1].imshow(time_grid, cmap="magma", origin="lower")
42    axes[1].set_xticks(range(len(maxneighbors)))
43    axes[1].set_xticklabels([str(m) for m in maxneighbors])
44    axes[1].set_yticks(range(len(numlocals)))
45    axes[1].set_yticklabels([str(n) for n in numlocals])
46    axes[1].set_xlabel("maxneighbor")
47    axes[1].set_ylabel("numlocal")
48    axes[1].set_title("Runtime (s)")
49    fig.colorbar(im1, ax=axes[1])
50
51    out = "parameter_sensitivity.png"
52    fig.savefig(out, bbox_inches="tight", dpi=150)
53    print(f"Saved {out}")